Author: Rachel Bouvier

January 8: Crafting an Economically Sustainable Working Waterfront

January 8: Crafting an Economically Sustainable Working Waterfront

Date:  January 8, 2019

Time: 4:00PM

Location:  Gulf of Maine Research Institute, 350 Commercial Street, Portland

Dr. Rachel Bouvier will be the featured presenter at the next Waterfront Alliance Meeting on Tuesday, January 9th.  She will be joined by other community members as part of a discussion on the topic:  Crafting an Economically Sustainable Working Waterfront.

FMI: https://www.waterfrontalliancemaine.org

Defining Safety Levels for Particulates Could Hurt Your Health – and the Economy

Defining Safety Levels for Particulates Could Hurt Your Health – and the Economy

You’ve probably heard about some of the recent changes from the Environmental Protection Agency (EPA). But you might have missed the proposal about particulate matter (PM), since it didn’t get as much press. Or even if you saw it, you might not have recognized all the implications because they’re not immediately obvious.

This proposal is to define a safety threshold for what’s called PM 2.5, and it’s a reversal of the EPA’s prior stance. Until recently, the EPA said that no amount of particulate matter can be considered safe. Changing that could have serious impacts on our health – and the economy.

What is PM 2.5, and where does it come from?

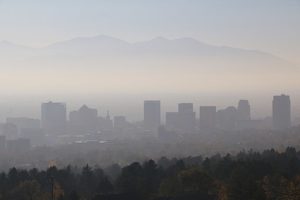
Even if you’ve never heard of particulates, you’re likely familiar with them. These are the fine particles of liquids and solids that contribute to haze-filled cities and poor air quality. In fact, another name for PM is particle pollution.[1] This is because the tiny size allows these particles to get everywhere – including deep in your lungs.

PM 2.5 is a specific kind, named because the particles are only 2.5 micrometers in size. For comparison, an average human hair is 75 micrometers in width.[2]

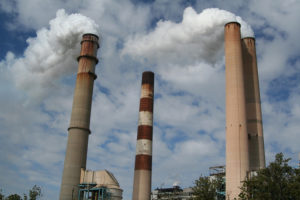
These tiny materials are everywhere, coming from a number of places, including cigarettes and fireplace smoke. But the vast majority come from two sources:

–          50% is from industrial production, with 20% of that from coal-powered plants

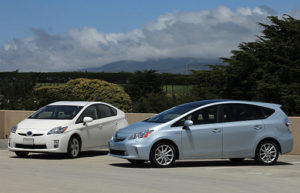
–          35% is from gas-powered vehicles of all kinds[3]

Costs and benefits with current policy 

Under the current policy, with no level of particulate matter considered “safe,” any reduction of PM 2.5 below current levels is considered a benefit, and can be included in federal cost-benefit analyses.

In other words, if regulations to reduce greenhouse gases simultaneously reduce PM 2.5 (as they would, given that they share many of the same sources), that reduction counts as a co-benefit. And those co-benefits can play a significant role in the cost-benefit analysis of any proposed regulation to reduce greenhouse gases.

For example, the Clean Power Plan from the Obama era had an estimated $20 billion in climate benefits. But the benefits go up when you consider that the same technology used to reduce power plant emissions would also cut PM levels. Those changes result in an additional $13 to $30.3 billion in health benefits, effectively doubling the benefits.

Similarly, the Mercury and Air Toxics standards save $4 to $6 million by reducing toxins. And in this case, the co-benefit from reducing particulates is even higher, coming in between $37 and $90 billion.[4]

Proposed change reduces benefits

Now, under the proposed changes, lowering PM levels below the suggested “safety levels” won’t count as a benefit. After all, if anything below the threshold is already considered safe, bringing it down even further won’t be helpful.

This means that moving forward, climate change initiatives like the Clean Power Plan wouldn’t be able to factor in the lower levels of PM 2.5. And without that, the initiative might not get implemented, because the cost would be considered too high without the co-benefit to offset it.[5]

Damages from air pollution

 The impact on regulations is a concern, but those aren’t the only considerations. Air pollution already causes damages between $75 and $230 billion annually. And PM 2.5 contributes more to that than their size indicates.

Even though these particulates only account for 6% of emissions by weight, they cause 23% of the damages. The damages from PM 2.5 alone are between $17.25 and $52.9 billion annually. [6]

Health and economic impact

Most of the economic damage caused by PM 2.5 is due to increased health costs.[7] Health issues associated with PM 2.5 include:

–          Respiratory illnesses like bronchitis

–          Premature death

–          Low birth weight

–          Higher risk of asthma

–          Greater risk of heart disease

–          More instances of lung cancer

These conditions all carry increased economic cost. Some of this is a result of increased medical care, such as hospital visits and medication. [8]

But the costs also come from lost work time and reduced productivity. People who need to take time off for appointments and medical care won’t be as effective. Similarly, those who can’t breathe as well have less energy and will be less productive, even if they don’t require urgent care.

In addition, since particulates contribute to poor air quality, people might be more likely to stay inside. This means lost revenue from outdoor recreation and the potential of reduced health from lower levels of activity.

Poor air quality actually could have a negative impact on region’s workforce. Putting a priority on quality of life is becoming more common – including looking at factors like air quality. If an area has a distinct haze, or higher levels of respiratory conditions, people may choose to leave, or to not move there to begin with.[9]

Conclusion

While it’s impossible to identify all the effects of the EPA’s proposed safety threshold, it’s clear that the negative impacts could be far-reaching. Given that, the EPA and other agencies should take all of the risks into account before accepting a change that could cause such extensive damages to our environment, our health, and our economy.

Photo Credit:   Eltiempo10 [CC BY-SA 4.0], from Wikimedia Commons

[1] https://airnow.gov/index.cfm?action=aqibasics.particle

[2] http://www.sciencemag.org/news/2018/08/kill-climate-rule-trump-s-epa-wants-redefine-danger-soot

[3] http://www.rff.org/blog/2007/what-do-damages-caused-us-air-pollution-cost

[4] http://www.sciencemag.org/news/2018/08/kill-climate-rule-trump-s-epa-wants-redefine-danger-soot

[5] Ibid

[6] http://www.rff.org/blog/2007/what-do-damages-caused-us-air-pollution-cost

[7] Ibid

[8] https://www.brookings.edu/blog/jobs/2011/05/06/we-are-what-we-breathe-the-impacts-of-air-pollution-on-employment-and-productivity/

[9] https://www.forbes.com/sites/quora/2018/05/29/how-the-air-quality-where-you-live-might-be-affecting-your-health/#2881f8b37017

The Avoided Cost of Stormwater Remediation

The Avoided Cost of Stormwater Remediation

Here’s something to think about during the next rainstorm: where does all that rainwater go?  For most of us, it’s not something to which we give more than a passing thought. But if you’re concerned about saving money and protecting water quality, it’s worth a closer look.

In many older New England towns, the infrastructure that conducts sewage from our homes to our wastewater treatment plant is old, crumbling, and not up to today’s needs. During relatively dry times, the system works pretty well.  Pipes convey sewage to the sewage treatment plant where it is treated and then released.  But during times of intense rainfalls, that excess water running down our streets to our storm drains can overwhelm those older pipes. During those times, the pipes essentially overflow, and raw sewage mixed with stormwater can make it into rivers and oceans.  These discharges are called combined sewer overflows, and despite heroic efforts to separate them, they do still exist (see our prior blog posts Money Down the Drain Part 1 and Part 2).  Recently in Portland, Maine a heavy rainfall, combined with human error, contributed to a million-plus gallon spill of partially treated sewage directly into Casco Bay.

There are several different strategies for a city or municipality attempting to address its stormwater issues. Coming up with those strategies may be a job for an engineer. Prioritizing those strategies, on the other hand, may be a job for an economist: someone who can weigh the costs and the benefits of each, keeping in mind that there may be hidden costs and benefits to each alternative that are not immediately obvious. Determining the financial costs of each strategy is relatively easy.  But coming up with the benefit – the return on investment, or bang for your buck –  isn’t as straightforward.

Stormwater management can bring economic and fiscal benefits in terms of “avoided costs.” By reducing the flow of stormwater that needs to be treated, the municipality saves the money that it would otherwise have needed to treat it.  That’s not insubstantial.  Treating a gallon of stormwater can cost substantial amounts of money in operations and maintenance costs (think electricity, chemicals, filter replacement, sludge disposal, etc.). Every gallon of runoff that is diverted from the treatment plant is that much money saved.

In addition to avoided treatment costs, there are avoided property damage costs.  Floods that are caused or exacerbated by excess stormwater (sometimes called “urban flooding”) can cause damage to property. A 2014 study in Cook County, IL, found that chronic and systematic urban flooding had led to property damage claims of over $773 million over a five year period.  This number is likely a significant underestimate, as flood insurance only covered a small portion of all damage costs.  Less easily measured are the costs of disruption to emergency services like police, fire and ambulance services,  and losses to private companies  that not only may lose inventory but business as well.

The benefits of dealing with stormwater include the avoided costs of treatment, as well as the avoided costs of flood damage, but that’s not all.  Other categories of avoided costs include the costs of treating waterborne diseases. Untreated wastewater that flows into our rivers, streams, and oceans can carry with it diseases and pathogens.  Treating those diseases in humans has economic costs.  A recent study published in the journal Environmental Health estimated that the “economic burden” – defined as both direct treatment costs and indirect opportunity cost, such as lost productivity – of recreational waterborne illness cost the nation upwards of $2.2 – $3.7 billion annually.  That’s a lot of money.

Moreover, contaminated wastewater that flows into our waters can have a detrimental effect on industries that depend on clean water.  For example, a recent study from the University of Maine estimated that the closures of shellfish beds caused by toxic algal blooms linked to pollution from combined sewer overflows led to at least $3.6 million in lost revenue over a nine year period. That amounted to approximately 27.4% of revenue from those beds.

Estimating the avoided costs associated with a particular stormwater management option depends on how much stormwater is treated or diverted relative to the baseline, as well as the location attributes of the site and the impacts untreated stormwater can have on the environment it is released into.  It isn’t always easy to calculate, but it is information that is needed in order to know the true benefits of a stormwater treatment system.

Stay tuned for upcoming blog posts on the benefit of green infrastructure in stormwater treatment and the fiscal impacts of urban flooding.


Third Quarter Journal Review

Third Quarter Journal Review

1. “Estimating the Societal Benefits of Carbon Dioxide Sequestration Through Peatland estoration,” Ecological Economics Volume 154, December 2018, Pages 145-155, Emily Pindilli, Rachel Sleeter, Dianna Hogan

We at rbouvier consulting are very interested in ecosystem restoration, and in particular, methods that economists might use to measure the benefits of ecosystem restoration.  This article presents an analysis of the benefits associated with managing and restoring the Great Dismal Swamp National Wildlife Refuge in Virginia (particular appropriate for a dismal scientist!).  The GDS is a forested peatland.  While there are those who might look at the swamp and appreciate it solely for its aesthetic appearance, a system such as the GDS can provide essential ecosystem services in terms of carbon sequestration.  In fact, the authors find that actively managing and preserving the swamp can provide benefits to society of up to $524 million, above and beyond management costs.  The authors use the social cost of carbon (link to blog post here) to monetize the benefits.

2. “Neither Boon nor Bane: The Economic Effects of a Landscape-Scale National Monument,” Land Economics, Volume 94, Number 3, August 2018, pp. 323-339, by Paul M. Jakus, Sherzod B. Akhundjanov.

The designation of a national monument has been a source of controversy over the past several years.  Proponents of national monuments point to the potential increase in tourism that such a designation can bring, whereas opponents point out the restrictions that are sometimes made (such as restrictions on hunting or ATV use).  This article looks at the Grand Staircase–Escalante National Monument in Utah, and examines trends in economic activity both before designation and after designation.  Their conclusion is that, at least in this case, designation as a national monument neither helped nor hindered the per capita income of the region.  However, as the authors point out, economic efficiency is only one metric by which to measure the success of a national monument designation.  It would be helpful to study other recently-designated national monuments to see if their results are transferable.

3. “Population health effects and health-related costs of extreme temperatures: Comprehensive evidence from Germany,” Journal of Environmental Economics and Management 91 (2018) 93–117 by Martin Karlsson and Nicolas R. Ziebarth.

Given some of our current projects, we have been very interested in the local costs of climate change-related events. While this article was published in Germany, it nonetheless gives us an idea of the health related costs of extreme temperatures – and a possible methodology to follow.  The article finds that extreme heat “significantly and immediately increases hospitalizations and deaths.”  The effects decline over time, as one might imagine, but the economic impact include not just the cost of treatment, but lost productivity as well.  An interesting methodological result is that  their findings hold whether they use standard economic models or epidemiological models – good news for those doing their research in either field.

4. “Urban Stream Restoration Projects: Do Project Phase, Distance, and Type Affect Nearby Property Sale Prices?” Land Economics, Volume 94, Number 3, August 2018, pp. 368-385, by Maya Jarrad, Noelwah R. Netusil, Klaus Moeltner, Anita T. Morzillo, J. Alan Yeakley

We were also interested in this article, which investigated whether urban stream restoration projects affected nearby property values.  We have done some work related to this in the past. The authors find positive effects on property values for properties located in close proximity to storm water, floodplain, and revegetation projects, but negative effects for wetland restoration projects.  They identify two counter-vailing effects that could help to explain: a “benefit” effect, whereby the restored area conveys benefits onto nearby properties (such as storm  water mitigation or flood reduction) and a “damaged goods” effect (wetland restoration can often necessitate large – temporary –  aesthetic damage that might affect a property’s sale price). 

Vulnerability Assessements: What are they and do you need one?

Vulnerability Assessements: What are they and do you need one?

Vulnerability assessments are a hot topic in sustainability and climate adaptation circles these days.  It is the process of looking at a system and trying to figure out what might make that system fail under particular circumstances so that you can begin to find ways to mitigate those possible failures.  The system might be anything from a computer network, to a power grid, to a neighborhood.   When it comes to climate adaptation the assessment generally looks at how a system, such as town, or piece of infrastructure, would be impacted by certain effects of climate change.  It can be an indispensable tool in climate adaptation planning.

Most vulnerability assessments utilize a four-step process.  These steps include[i]:

  1. Scope
  2. Collect
  3. Assess
  4. Apply

Scope. This is the planning part of the process.  It is probably the most time consuming and you should allow plenty of time to complete it as it is the foundation of your assessment.  It includes defining the parameters of the system you are looking at, who needs to be involved, and asking question such as:

  • What asset or system are you choosing to focus on?
  • What are the climate stressors that will impact it?
  • Who might be impacted by these climate stressors on this particular asset or system?
  • What information do you not have that you might need to collect?
  • What resources might you need to help complete your assessment?


This may seem like a lot of information to come up with, but it may be a little less intimidating if we use an example, such as the main road through a medium sized town. What assets are we focusing on?  The main road through our downtown.

  • What are the climate stressors? The road floods more and more frequently due to a nearby river overflowing when large rainstorms and hurricanes come through the region.
  • Who is impacted? People who live near or who have businesses in the downtown area.  Emergency vehicles that need to have a fast route to those in need.  People from other towns who travel through on their way to other places and those who come to town to do business.
  • What information do you need to collect? The frequency of flooding and assessments of past damage. Perhaps a count of cars that travel the road.  Documentation of alternate routes of travel should the road be flooded.  A list of your possible actions for mitigation of the flooding, along with potential costs if you already have some in mind.  Often people do not have solutions at this stage but will be using the assessment to determine what issue should be dealt with first.
  • What resources might you need? Do you have the inhouse expertise, personnel, or time available to do the assessment? You may need to contract with a consultant or other experts to assist with the process.
  • Other important questions include how to fund the assessment and what your timeframe is for completion.

Keep all this information, the questions and your answers, handy.  This is a roadmap for your assessment.  You will need to refer to it as you move through the process.  You may discover that you need to ask more questions, or you may find that something you felt was relevant no longer is.

Collect. This is just what it sounds like.  It is collecting the information and data you need to do the assessment.  Some of the information might already have been collected by other people.  Rainfall amounts, storm frequency, or weather history can often be provided by government agencies.  But there are other items that may not be readily available.  How many emergency call responses have been delayed by the road flooding?  You may need to do a survey of residents to find out how many times they needed to find alternate travel routes.  Or perhaps you need to set up equipment to count the number of cars that travel the roads.  If you are collecting financial information on past damages you will need to know what your parameters are – are you counting just damage to the road itself, will you include losses to business, or the value of the extra travel time for residents who need to find alternate and possibly longer routes.

Assess.  Once you have collected the information you need, it is time to put that information to use.  You will want to use this information to answer questions about which areas of the road are most vulnerable.  Is there one area that is damaged more often than other parts of the road?  Are there certain populations that are most vulnerable to the impacts?  At this point you may also find that some of your assumptions were incorrect and there are other issues you were not aware of.  Again, you may want some experts to assist you on this.

Apply.  Now you have your information, you’ve figured out which parts of the road are most at risk, how much future flooding could cost your town, and who is most affected by it.  You can now use this information to prioritize your solutions.  This might be determined by cost such as which repairs or mitigation techniques will prevent the costliest damage.  Or you might base it on human need, giving emergency vehicle access priority.  It might also be time based.  Is there a part of the road that is most at risk right now?

A vulnerability assessment is a vital tool when it comes to assessing the impacts of climate change and how to plan your adaptation strategies.  But once it is done, don’t set the assessment aside.  It will be a roadmap that you can refer to as you move forward.  Once you have implemented your first solution you will need to review what to do next.  You may also want to use it as a reference for future assessments as an accounting of what worked and what didn’t.  It can continue to provide you with the information you need to best meet the changes and challenges that climate change will present in the future.

————

[i] This four-step assessment process is based on the vulnerability assessment process as presented by the National Oceanic and Atmospheric Administration (NOAA) at the Adaptation Planning for Coastal Communities conference in Brunswick, Maine in the spring of 2018.

Photo by Daniel Case

Second Quarter Journal Review

Second Quarter Journal Review

 1. The Economic Impacts of Climate Change: Richard S J Tol, Review of Environmental Economics and Policy, Volume 12, Issue 1, 1 February 2018, Pages 4–25, https://doi.org/10.1093/reep/rex027:

This article focuses on aggregate indicators of the effects of climate change on total economic welfare and on the distribution of those welfare impacts. The author argues that while climate change may, initially, have “net positive” benefits in the aggregate, the impacts turn globally negative after a certain degree of warming is met. Moreover, the negative effects of climate change will fall disproportionately on developing nations: first, because of their exposure (less developed countries typically have a larger share of their economic activities directly related to environmental resources); second, because less developed countries tend, on the whole, to be located in hotter areas; and finally because less developed countries often lack access to medicines and technologies that could help temper the negative impacts. 

The latest issue of Environment and Development Economics is devoted to investigating the links between poverty and climate change.

2. The economics of urban afforestation: Insights from an integrated bioeconomic-health model: Journal of Environmental Economics and Management 89 (2018) 116e135

Switching gears slightly from the impacts of climate change to ways of potentially mitigating it, a recent article in the Journal of Environmental Economics and Management looked at “urban afforestation,” the idea of planting trees in urban areas. Urban afforestation, the authors claim, generate co-benefits in terms of public health and well-being. Using a tree planting program in New York City, the authors use an integrated bio-economic and health model to demonstrate that annual net benefits range from $10.24 to $12.10 per tree planted, even after accounting for costs and any ill health effects from pollen.  These benefits arise from carbon sequestration, air pollution reduction, storm water reduction, and aesthetic effects.  


3. Genuine Economic Progress in the United States: A Fifty State Study and Comparative Assessment: Mairi-Jane V. Foxa , Jon D. Ericksonb,C,  Ecological Economics 147 (2018) 29–35

How do we measure economic success?  GDP, the conventional measure of the success of an economy, doesn’t do a very good job of measuring economic welfare. To give just a few examples, GDP doesn’t include volunteer or household labor, doesn’t account for pollution, and is not adjusted for what might be called the “depreciation of natural capital.” The Genuine Progress Indicator, or GPI, was developed to address those short-comings.  A recent article in the journal Ecological Economics presents the first 50-state estimate of the GPI in the United States. Interestingly, over 90% of the variation between the states can be explained by the depletion of non-renewable energy resources, personal consumption expenditure, and motor vehicle crashes.  The article makes for very interesting reading. 


Is the proposed hybrid/electric vehicle tax a good idea?

Is the proposed hybrid/electric vehicle tax a good idea?

Photo: Robert Scoble

In February, Maine’s Governor LePage proposed implementing a fee on the owners of electric and hybrid vehicles.[1]  He is not alone – 17 other states have already implemented similar fees[2]).  It may seem, at first glance, to be yet another slap in the faces of “liberal-minded environmentalists.”  But giving the Governor the benefit of the doubt, it’s actually attempting to solve a problem that’s been seemingly intractable for years: that the state highway trust fund is overextended, at a time when the state’s infrastructure is badly in need of investment.

Maine, of course, is not alone. The Federal Highway Trust fund, which is primarily funded by federal taxes on gasoline, is also underfunded and over-extended.  Much like other issues in Congress, though, potential solutions seem to be few and far between, and no politician wants to propose anything as unpalatable as a tax increase.

So, what’s the problem? The highway funds at both the federal and the state level are funded primarily through taxes on gasoline.  In Maine, slightly less than 70% of revenues earmarked for the State Highway Fund are from gasoline taxes.  Another 27% come from vehicle registrations and fees, leaving the remaining 3% to come from various other sources[3].  In 1991, the first year for which revenue for the highway fund is reported on the legislature’s web site[4] , the highway fund received approximately $197 million (or approximately $363 million in today’s dollars).  In 2015, the fund received approximately $308.5 million (or $327 million in today’s dollars).  That’s a decrease of about 10% in real terms, despite the fact that the Association of Civil Engineers has given Maine a D on roads, essentially unchanged since 2008.[5]

Moreover, whereas the federal government has supplemented its declining revenues with other sources (with questionable legality), Maine cannot do the same. So how did we get in this mess?

The answer is that the tax is poorly targeted and creates perverse incentives.  Let’s start with the targeting question.  Taxes are supposed to do several things, from an economic viewpoint: raise revenue and change behavior.  In this case, the tax is primarily to raise revenue for the highway system.  Some environmentalists would also like to see the gasoline tax used to reduce the demand for and usage of gasoline, as one of the culprits in climate change, but the two objectives are fundamentally at odds, for several reasons.

First, if the revenue from a tax is used to fund a particular program, then the tax should be designed to bring in a sustainable amount of revenue year after year.  In this case, the revenue from the gasoline tax has been declining year after year. This decline is due to both technological advances and changes in demand.  Average fuel economy for passenger cars has been generally rising since 2000, and the trend has been similar for trucks since about 2004.  Average fuel economy for both cars now stands at about double what it was in the 1970s, meaning today’s cars can travel twice the mileage on a tank of gas than they could back in the 70s[6].  That’s great news for the environment, but not great news for those who depend upon the revenue from the gas tax.

Second, even as the Maine population increases, the number of miles driven has not increased.  In fact, whereas you normally might expect to see people driving more miles as it becomes cheaper to do so, we aren’t seeing such a trend.  In fact, while Mainers drove about 14,925 in 2005, that number actually dropped to 14,838 in 2016[7]. So, the revenue from the gas tax has been hit doubly hard: the average miles per gallon has increased, while the number of miles driven per year has decreased.  We could of course increase the gasoline tax (it hasn’t been increased since 2011), but that is likely to further dampen the demand for purchases of gasoline.

So, what to do?  We could, of course, follow Governor LePage’s recommendation and impose a surcharge on hybrid and electric vehicles. In one way, that would address the “free rider” problem that some analysts have pointed out: that owners of hybrid and other fuel-efficient vehicles use the highways as much as others, but don’t pay their “fair share” to the highway fund.[8]

Ultimately, though, that would not solve the problem, because the gas tax is poorly targeted in the first place.  The wear and tear on our infrastructure is tied to the usage of the highway, which is only imperfectly proxied by gallons of gasoline purchased.  A better targeted tax would be to impose a tax on vehicle miles driven, like the one currently being studied by the Colorado Department of Transportation. [9]  Of course, such a system would require some method of tracking number of miles driven, either through electronic monitoring such as those already in place on tolled highways, or through some other system.

Such a tax would not, of course, create an incentive for individuals to buy more fuel-efficient vehicles, which is one of the reasons why environmentalists like the gas tax.  The gas tax, in their mind, is akin to a cigarette tax, which aims to curb smoking by increasing the price.  But if the goal there is to reduce carbon emissions, a tax on the carbon content of fuel, not the gasoline itself, would be a more efficiently targeted tax.  But that’s a different blog post, for a different day. (You may view my blog posts on the carbon tax, here and here.)

[1] https://www.epa.gov/fuel-economy-trends/highlights-co2-and-fuel-economy-trends

[2] https://www.fhwa.dot.gov/policyinformation/statistics/2013/hm60.cfm

[3] http://www.thedrive.com/tech/18549/maine-and-colorado-struggle-to-tax-electric-cars-fairly)

[4] https://www.pressherald.com/2018/02/08/legislation-calls-for-new-annual-fee-on-all-electric-hybrid-cars-in-maine/

[5] https://www.greentechmedia.com/articles/read/13-states-now-charge-fees-for-electric-vehicles#gs.y_6lSMM

[6] http://legislature.maine.gov/legis/ofpr/highway_fund/pie_charts/Hfpie1213.pdf

[7] http://legislature.maine.gov/legis/ofpr/highway_fund/rev_exp_history/index.htm

[8] https://www.infrastructurereportcard.org/wp-content/uploads/2016/10/Maine-Report_Card_final_booklet.pdf

[9] https://www.denverpost.com/2017/12/12/colorado-mileage-tax-experiment/

First Quarter Journal Highlights: Regulations Behaving Badly

First Quarter Journal Highlights: Regulations Behaving Badly


A recent article in the Journal of Environmental Economics and Management (JEEM) coined a new (albeit clunky) phrase: the macroeconomic environmental rebound/backfire effect.  This effect occurs when a “green improvement,” such as an energy efficiency program, results in less of an environmental improvement than expected. This is not due to unrealistic expectations, but due to what the authors term the substitution, wealth, and sectoral reallocation effects. The substitution effect occurs when the green promotion lowers the price of the green good relative to the dirty one, and so households adjust their consumption towards the green good and away from the dirty one.  So far, so good.  But the wealth effect can work in the opposite direction. As households experience an increase in their buying power due to the now (relatively cheaper) green good, they will purchase more of everything in what economists term their “consumption bundle” – including dirty goods. Finally, the sectoral reallocation effect occurs when firms reallocate their resources between the dirty and green sectors.  Depending upon the magnitude and intensity of these three effects, a green improvement could actually lead to an increase in pollution. (Environmental rebounds/backfires: Macroeconomic implications for the promotion of environmentally-friendly products. Juin-JenChang, Wei-NengWang, Jhy-YuanShieh, Volume 88, March 2018, Pages 35-68)

Also in JEEM this quarter is a very interesting article looking at the potential for “spillovers” when regulating multiple pollutants, such as greenhouse gases and particulate matter.  A regulatory spillover is when a regulation aimed at one pollutant has an effect (either positive or negative) on the emissions of another pollutant.  For example, carbon dioxide and particulate matter are both formed through the combustion of fossil fuels, so a policy aimed at reducing the emission of greenhouses gases may reduce particulate matter at the same time. That’s an example of a positive spillover.  However, as the article points out, it’s also possible that a regulation may have a negative spillover; for example, switching from fossil fuels to biomass may reduce emissions of carbon dioxide, but increase emissions of nitrogen oxides or particulate matter.  Failure to account for policy spillovers, either positive or negative, can lead to poorly targeted regulations. 

The authors consider a transboundary pollutant (such as carbon dioxide) and a local pollutant (such as particulate matter).  For policy options, they consider emissions taxes and emissions quotas.   They find that policies to reduce greenhouse gases can lead to positive spillovers for local pollutants if the technologies that are used to reduce both are complementary. This is not a surprising result. However, they then look at whether there is an international agreement in place to reduce greenhouse gas emissions. Their results suggest that if there is such an agreement in place, emissions of the local pollutant may actually increase if countries behave strategically (I.e., increase their emissions in the hopes of getting larger quotas), or when the revenue from a tax is kept within its borders. Policy spillovers in the regulation of multiple pollutants Pages 114-134 JEEM Stefan Ambec, Jessica Coria Volume 88, March 2018        

Of real interest to us in New England is a recent article that appears to suggest that the Regional Greenhouse Gas Initiative (RGGI), geared at reducing carbon emissions in some northern states, actually is associated with an increase in carbon emissions elsewhere (a phenomenon called “leakage” that occurs when regulations designed to reduce emissions in one geographic area actually increase emissions somewhere else).  While emissions decreased overall, authors found, the decrease was partially offset by an increase in neighboring states.  They conclude that such leakage means that we cannot attribute quite as much of a decrease in emissions to RGGI as originally thought.  Leakage in regional environmental policy: The case of the regional greenhouse gas initiative Harrison Fell and Peter Maniloff JEEM Volume 87, January 2018, Pages 1-23 

And finally, a slightly different type of article: several researchers from the University of Pisa in Italy investigated the links between per capita income and new cancer incidence by looking at a cross-sectional dataset from 122 countries.  They found that the incidence rate of all-sites cancer increases linearly with per capita income, even after controlling for population ageing, improvement in cancer detection, and omitted spatially correlated variables.  The article lends further support to the so-called “cancer transition hypothesis,” a theory that links economic development with a shift in the onset of cancers from those linked with infectious diseases to those linked with other types of risk factors.  To quote from the article itself: “our analysis shows that the cancer epidemic cannot be explained solely by higher life expectancy, by better statistics and by regional peculiarities: rather, a significant role must also be attributed to environmental degradation and life-styles. Unfortunately, our regressions are unable to distinguish between the two” (p 388).  Unfortunate, indeed.  Ecological Economics 146 (2018) 381–396 Economic Growth and Cancer Incidence T. Luzzati , A. Parenti, T. Rughi 

Keeping the Lights On Doesn’t Mean More Pollution

Keeping the Lights On Doesn’t Mean More Pollution

Photo – Creative Commons/Flickr Amy the Nurse

In August of 2017, Energy Secretary and former governor Rick Perry proposed to strengthen subsidies to coal- and nuclear-fueled electricity plants.  Why?  According to his proposal, coal and nuclear power plants are indispensable to our national security by virtue of the fact that they can store energy on-site. And, since the past few years have seen declines in both coal and nuclear facilities in the United States, the concern is that the nation’s electricity grid will be less reliable in the future. The proposal would have guaranteed cost recovery and a fair rate of return for generators that can store at least 90 days’ worth of energy on site.  Fortunately, the Federal Regulatory Commission rejected it.  Even so, it’s still worth looking at the pros and cons of such a proposal.

More power outages and more disruptions would, of course, harm our energy-intensive economy. As the recent spate of hurricanes (including high winds in my home state of Maine) have shown, such energy disruptions can be costly. In fact, 2017 was the costliest year in terms of economic damages from natural disasters in the US.

Would subsidizing coal and nuclear facilities really have been the best solution? To answer that, we need to take a deeper look.  When I teach cost-benefit analysis, I encourage my students to consider the baseline – what would have happened in the absence of the policy or proposal in question. The number of coal and nuclear plants in this country has been declining for decades. The decline can be attributed to several factors, including environmental regulations, but mainly the declines are due to market forces (low electricity prices, declining electricity demand, and new supplies from natural gas) and aging infrastructure. Without taking a close look at the finances of the plants in question, we can assume that at least some of these plants would have been likely to follow.  Increasing subsidies to already struggling nuclear and coal plants would likely have been just another case of throwing good money after bad.

When considering the costs and benefits of the proposed plan, there would have been several different categories, each accruing to different groups.  The beneficiaries of the plan would likely have been owners and shareholders of the qualifying coal and nuclear plants.  Their consumers, as well, may have benefited from a lower average wholesale price of electricity; however, the proposal recommended adding a surcharge to consumers’ bills in order to cover the costs. According to the analysis done by Resources for the Future, the drop in the wholesale price of electricity would not have been enough to cover the surcharge.

Moreover, practitioners of cost-benefit analysis need to carefully consider all the costs and benefits of a proposal, not just those that are easily monetized.  A complete analysis of the costs and benefits of Secretary Perry’s proposal should include the damages caused by pollution from coal and nuclear-powered plants to humans and agriculture. (While the generation of electricity from nuclear plants does not create air pollution, the mining for uranium does create environmental destruction.) Such external costs are in reality a passive subsidy that coal and nuclear plants have enjoyed for decades. An additional subsidy would exacerbate the problem. According to the analysis done by Resources for the Future, the proposed plan would have immediately increased sulfur dioxide and nitrogen oxide, two pollutants generated by the combustion of fossil fuel.  This increase in emissions is linked to an increase in premature deaths caused by respiratory diseases such as chronic bronchitis and emphysema. Once environmental costs are factored in, net benefits to society would have been decidedly negative.

The next question is: would the subsidies have alleviated the problem of grid instability? The answer to this question actually lies in the question itself.  Is there really a problem of power disruption caused by declining coal and nuclear plants? Some recent research by the Rhodium Group says no.  Researchers examined the data collected by the Department of Energy whenever an electricity generator experiences an outage or a disturbance.  Results indicate that disruptions in fuel supply were responsible for less than 1 one hundredth of one percent of lost customer service hours between 2012 and 2016.  The remainder were caused by disruptions to energy distribution  Primarily, those disruptions were caused by severe weather, not by supply disruptions.  The FERC ultimately agreed when it rejected Secretary Perry’s proposal.

However, the FERC did agree that the reliability of the grid was an issue looking into.  If the goal of Secretary Perry’s proposal was to increase the reliability of the grid – not just to prop up nuclear and coal – there are several less costly and ultimately beneficial ways of doing so.  One such possibility is to replace our nation’s aging energy-related infrastructure, much of which dates to the 1950s and 60s. Energy infrastructure actually received a “D+” on the 2017 report by the American Society of Civil Engineers. Upgrading the energy infrastructure would come with many ancillary benefits.

A second alternative would be to invest in distributed energy and microgrids.  Distributed energy is the use of small, decentralized power generation and storage systems. While larger utilities consider the rise of distributed energy to be a threat to the existing system, the greater use of distributed energy could actually increase the resilience of our current, outdated system.  However, doing so will require innovations in monitoring, modeling, “smart switches,” and other technologies to manage peak demand and integration.

A third possibility is to invest in better long-term energy storage. Lithium ion batteries may be our best choice for now, but other storage technologies, such as flow batteries or zinc air batteries.  But by far the best alternative – one that should be a crucial part of any solution – is energy conservation.  A unit of energy conserved is one that doesn’t need to be generated.  You don’t get much more reliable than that.

The Rising Cost of Hurricanes

The Rising Cost of Hurricanes

The hurricane season of 2017 has been a severely damaging one. Hurricane Harvey devastated parts of Texas, Maria savaged Puerto Rico, and Hurricane Irma dealt a punishing blow to an already-reeling Florida (not to mention Nate and Jose). As I write this, Hurricane Ophelia – the tenth named storm in a season that was predicted to be “less active than usual” – is brewing in the eastern Atlantic. Whatever the cause of this increase in hurricane frequency, though climate change is a likely culprit, no one can deny that these storms are growing more costly

The World Health Organization estimates that the global cost of hurricane damage per season is rising by 6% a year. (That’s in real dollars, not nominal, by the way, so inflation doesn’t factor into it.) If storms are increasing in strength and frequency, why is more not being to mitigate the costs?

Two words: incentives and avoidance.

Economists believe that people respond to incentives. Make an activity less expensive, and more people will engage in it. Make an activity more expensive, and the level of activity will drop off. Why is that important here?

It turns out that if policy makers make it relatively inexpensive to build your house in a floodzone, lo and behold, more people are going to build their houses in floodzones. Houses that are built in floodzones are, no big surprise, more prone to flooding. According to the Economist magazine’s recent article, Harris County, Houston’s home, has allowed 8,600 homes to go up in the 100-year floodplain. (The 100 year floodplain is not, despite its name, an area where a flood is expected to occur every 100 years. A 100 year floodplain is an area that has a 1 percent chance of being flooded in any given year. That means, over the life of a 30-year mortgage, the change of a such a flood occurring is just about 26 percent.) The more houses located in a floodplain, the greater the expected cost of such a flood. Simple math.

Not only that, but by developing in the floodplain, much of that land was converted from prairie land to impermeable surfaces, like roads, driveways, and sidewalks. Coastal prairie land can absorb large amounts of rainfall. Concrete and asphalt cannot, leading to more flooding and more runoff, and more erosion of existing soil, as the velocity of the water is increased by those impermeable surfaces. The act of putting more development in vulnerable areas is a double whammy – you’re putting more homes in harm’s way, and you’re taking away the natural infrastructure that helps protect against flooding in the first place.

I also mentioned “avoidance” as one of the reasons why hurricane costs have been increasing. It’s no surprise that most people tend to avoid thinking about negative information, and that applies to getting insurance. According to the Insurance Information Institute, only 12 percent of American homeowners had flood insurance in 2016. While most banks and mortgage companies require flood insurance if your home is in a high-risk area, federal law does not require coverage in a moderate to low risk area and almost 25% of all flood-related claims come from those areas. Why is that? Maybe they see it as too expensive, or they’re putting it off. Maybe they’ve simply made a bad bet. Or perhaps they expect the federal government to foot the bill. Even if the government does cover some of the damage (and the federal government did cover about 80% of Hurricane Katrina’s damages), that still means that taxpayers may be subsidizing an increasingly risky bet.

And those bets are becoming riskier. What was once considered a 100-year storm – that is, where the probability of one occurring is one percent annually – is now occurring more frequently. Scientists estimate the likelihood of a storm of a certain size occurring based on historical figures – and we know that more intense storms are happening more often. (For a great discussion of how the US Geological Survey draws the “flood maps,” see this piece from Five Thirty Eight.)

It’s not only the insurance companies, the homeowners, or the federal government who shoulders the increasing costs of hurricanes and other natural disasters. Municipalities can see a blow to their tax base, a rise in the cost of borrowing, and even the possibility of litigation if it’s found that the municipality issued building permits or approving subdivisions that increase the potential of flooding.

What can be done to stop these costs from continuing to increase? Well, for a starter, communities need to take a good long look at their land use regulations. We need to stop subsidizing bad risks. It should be more, not less, costly to build in flood plains. We need to stop subsidizing the conversion of wetlands and other buffer zones to development. We need to preserve our natural infrastructure. And, we need to implement more resiliency efforts.

Municipalities should also make sure that businesses and homeowners fully understand the potential costs of not having flood insurance We need to make sure that the people involved in these kinds of decisions have a clear understanding of the full social and environmental costs of their actions. These moves make economic sense as well as environmental sense.

rbouvier consulting’s mission is to promote a more transparent economy by making sure that social and environmental costs are included in economic decisions. Visit our website to find out more.